
Football Charts
A football results and statistics site that logs every model probability before kick-off and stakes a flat unit whenever the model beats the market price by 2 percentage points or more. It calls the ledger a research output, not a tipping service.
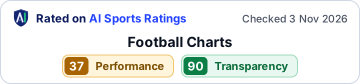
Our rating in one line: As of 3 Nov 2026, Football Charts's published record shows -11.94% ROI over 8,414 level-stakes bets (23 Jul – 3 Nov 2026), self-reported: Performance 37/100. Transparency score: 90/100 (high transparency).
- Type
- Football probability model (public calibration study)
- Sport
- Football
- Coverage
- Football, 90+ leagues
- Country
- Multi
- Price
- Free (research output; also a free API and dataset)
- Results
- View published results ↗
- Affiliate
- Unknown
- First seen
- Domain registered 1 Jul 2025 (RDAP record for football-charts.com, source)
At a glance
- ROI
- -11.94%
- Settled bets
- 8,414
- Period
- 23 Jul – 3 Nov 2026 (staked record)
- Evidence
- • Self-reported
18+. Link may be an affiliate link.
Performance breakdown
| How the score is built | |
|---|---|
| Raw score (50 + 1.25 × ROI, capped 0–100) | 35.1 |
| Bets that count (self-reported, × ½) | 4,207 |
| Sample weight = bets that count ÷ (bets that count + 500) | 0.894 |
| Performance score = 50 + (raw − 50) × weight | 37 |
| Published record | |
|---|---|
| Settled bets / selections | 8,414 |
| Profit / loss | -1,004.52 units (flat 1 unit) |
| Level stakes | Yes |
| ROI | -11.94% |
| Odds basis | Multi-bookmaker average price frozen about 30 minutes before kick-off |
| Period | 23 Jul – 3 Nov 2026 (staked record) |
| Basis of record | Self-reported (ROI derived by us from the published units and bet count) |
| Notes | 3,680 W – 4,734 L, 489 pending. ROI is our division of the published −1,004.52u by 8,414 decided bets. By market: over/under 4,955 decided −466.92u; 1X2 2,141 decided −415.93u. |
| Source | https://www.football-charts.com/track-record · checked 3 Nov 2026 |
50 = break-even. Past results don't predict future returns. How we score Performance.
Transparency score breakdown
| Criterion | Max | Status | Points |
|---|---|---|---|
| Picks published before the off, timestamped | 25 | ✓ Verified | 25 |
| Full public ledger including losers | 25 | ✓ Verified | 25 |
| Price basis stated (SP, BSP, exchange, CLV) | 15 | ✓ Verified | 15 |
| 500+ settled selections | 15 | ✓ Verified | 15 |
| Methodology documented | 10 | ✓ Verified | 10 |
| Results downloadable (CSV/API) | 10 | Not yet verified | 0 |
| Total | 100 | 90 |
Transparency score: how openly a tool or tipster publishes a record you can verify. How we score Transparency · How to raise a transparency score.
Is this you? Are you Football Charts?
If anything on this page is wrong or out of date, or you can share a fuller or newer record, a results page or your methodology, send us the public evidence. We review every request against our published criteria and log every change on the changelog. Ratings can't be paid for and are never influenced by affiliate status.
How to raise your transparency score · the same checklist for everyone
Embed this badge
Free for this listing. It shows the current rating and check date, updates when they change, and links back here. About the badge · Badge terms
Other football AI tools we rate
- OddAlerts AlphaPerformance 53 · Transparency 90
- OddsIntelPerformance 52 · Transparency 85
- GoalGrid AIPerformance 51 · Transparency 65
- KeplerPerformance 49 · Transparency 80
- Footlab AIPerformance 47 · Transparency 65
- Football Analytics (footballanalytics.pro)Performance 46 · Transparency 75
Guides: Best AI football prediction tools · Does AI sports betting work? · All guides
How we check records: The transparency checklist (what counts as evidence) · AI tipping transparency report 2026 (how many records pass)